Venture Capital Portfolio Construction Strategies

Most people think portfolio construction is something you do once, before you write your first check. You sit down, model out your fund, decide how many companies you want, and move on. That is not how it works. It is an ongoing discipline. And it has five moving parts that all have to stay coherent with each other at the same time.
Those five variables are:
- Number of initial investments
- Initial check size
- Target ownership percentage at entry
- Reserve ratio for follow-ons
- Stage and sector focus (which sets your expected loss rates)
Change one, and you are renegotiating all the others. That is the part most emerging managers underestimate. And honestly, it is the part that bites them hardest.
Here is where coherence falls apart in practice. Say you target 10% ownership at entry, but your check size is too small relative to the round size. You will never get there. The founder does not need to give you the allocation. Or flip it: you reserve 50% of your fund for follow-ons, but you spread your initial capital across 60 companies. Now your reserves are stretched so thin they cannot do meaningful work in any single position. The math collapses quietly while you are busy sourcing the next deal.
LPs are increasingly digging into these models during diligence. They want to see both diversification (enough companies to give the power law a fair chance) and conviction (enough ownership and follow-on capacity so that when a winner emerges, it actually moves the fund). Those two things pull in opposite directions, which is why construction is hard.
The thesis you start with sets your constraints. A seed fund focused on one sector has completely different loss rate assumptions, ownership expectations, and check size norms than a multi-stage generalist fund. The numbers have to match the thesis. If they do not, you have a math problem dressed up as an investment strategy.
The portfolio size debate and where the math actually lands
There is no consensus on optimal portfolio size. Serious, experienced practitioners genuinely disagree on this, and have for decades. Anyone who tells you otherwise is selling something.
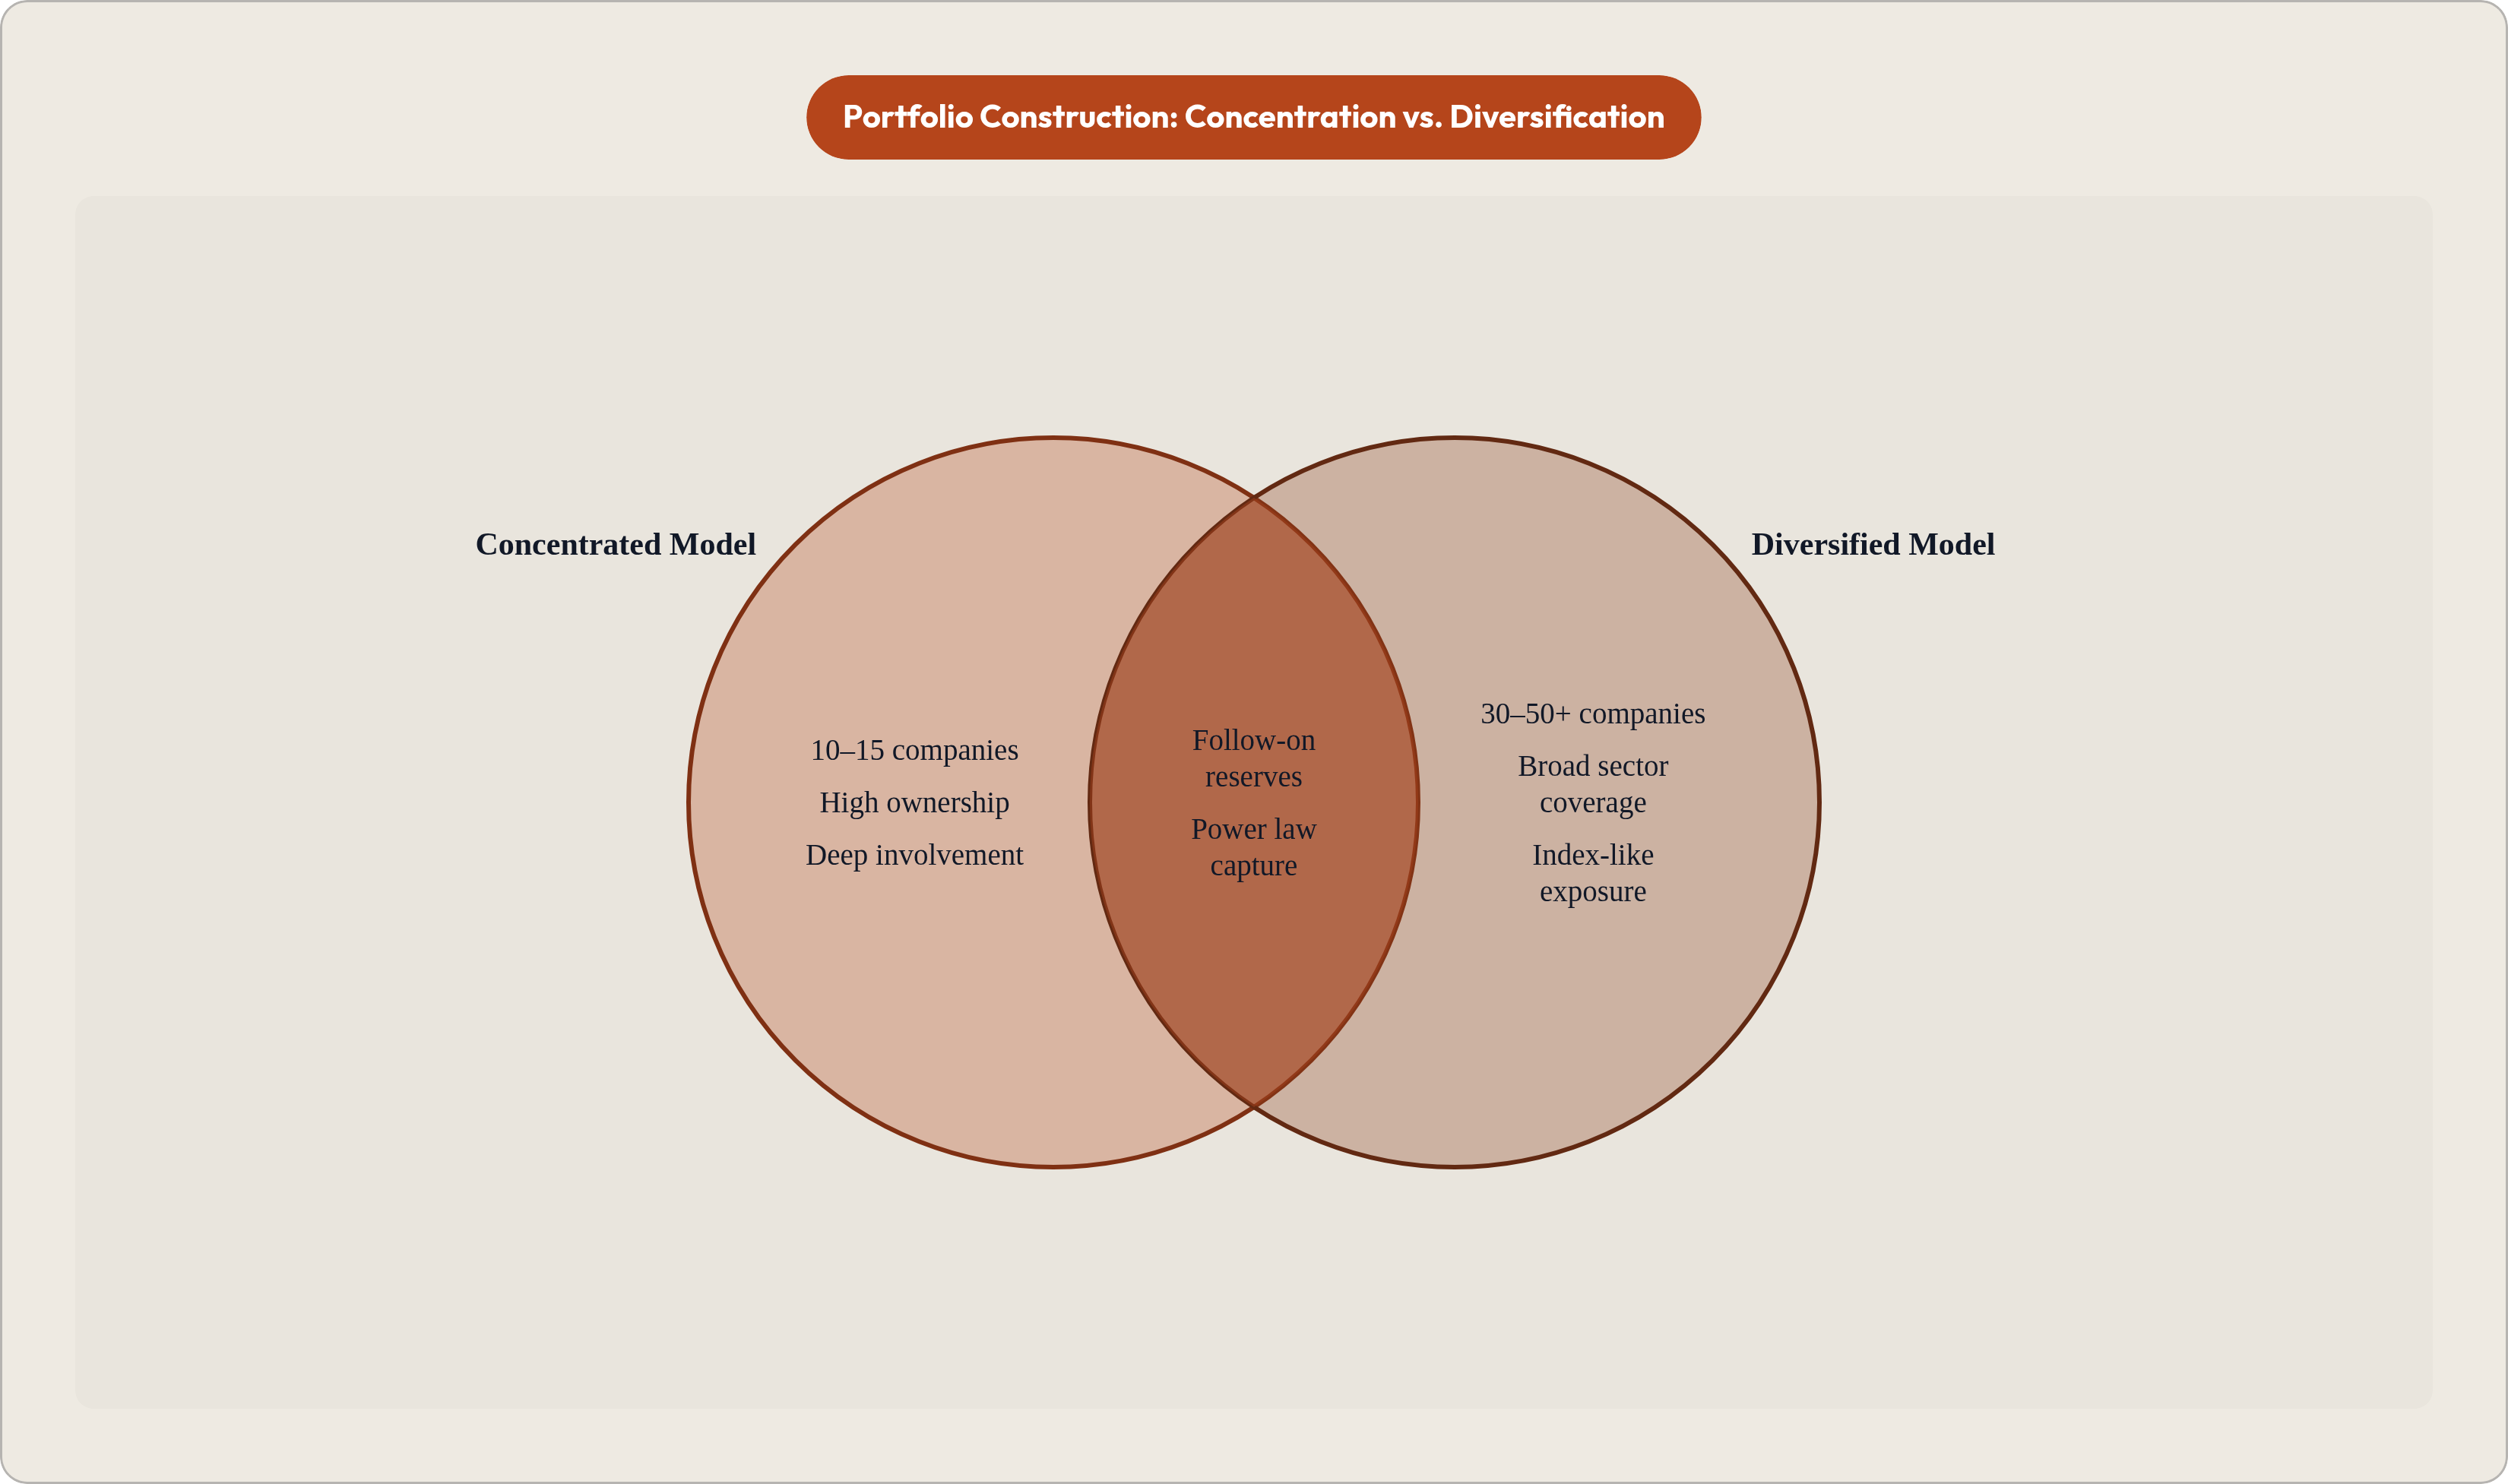
On the concentrated end, some managers run portfolios of fewer than 15 to 20 companies. Bigger checks, higher ownership, significant follow-on capacity per position. The bet is on conviction and hit rate. The risk is obvious: if a few core holdings disappoint, the fund is in real trouble. Sector-focused funds favor this approach.
On the diversified end, some funds back 30 to 50 or more companies. Smaller initial checks, broader coverage, maximizing the statistical probability of capturing an outlier. The risk here is equally clear: if your position sizes are too small, even a massive outlier barely registers at the fund level.
The math suggests a middle range of roughly 25 to 50 investments holds up well for medium-sized teams, both in terms of return potential and operational manageability. The Kelly Criterion, applied to venture, generally confirms an upper bound around 50 investments and validates the industry norm of 20 to 25 portfolio companies per fund.
There is also a human capital problem with larger portfolios that people underestimate. Academic research found that a 1% increase in portfolio size correlates with a measurable decrease in IPO or acquisition rates, partly because GPs simply run out of bandwidth to support each company meaningfully. At some point you stop being an investor and start being a scheduling problem.
Larger portfolios improve the probability of returning 2 to 5x of a fund. But they dilute the impact of any single outlier. Those two objectives are in genuine tension, and you cannot fully resolve it. You can only decide which risk you are more willing to carry.
The right number is a function of your fund size, your team's actual bandwidth, the stage you focus on, and what your model of value-add actually requires per company. There is no clean answer. Anyone who hands you one is ignoring at least two of those variables.
How fund size sets the ceiling on everything else
Fund size is not just a fundraising outcome. It is a portfolio construction input. It determines what strategies are even available to you.
The basic mechanics:
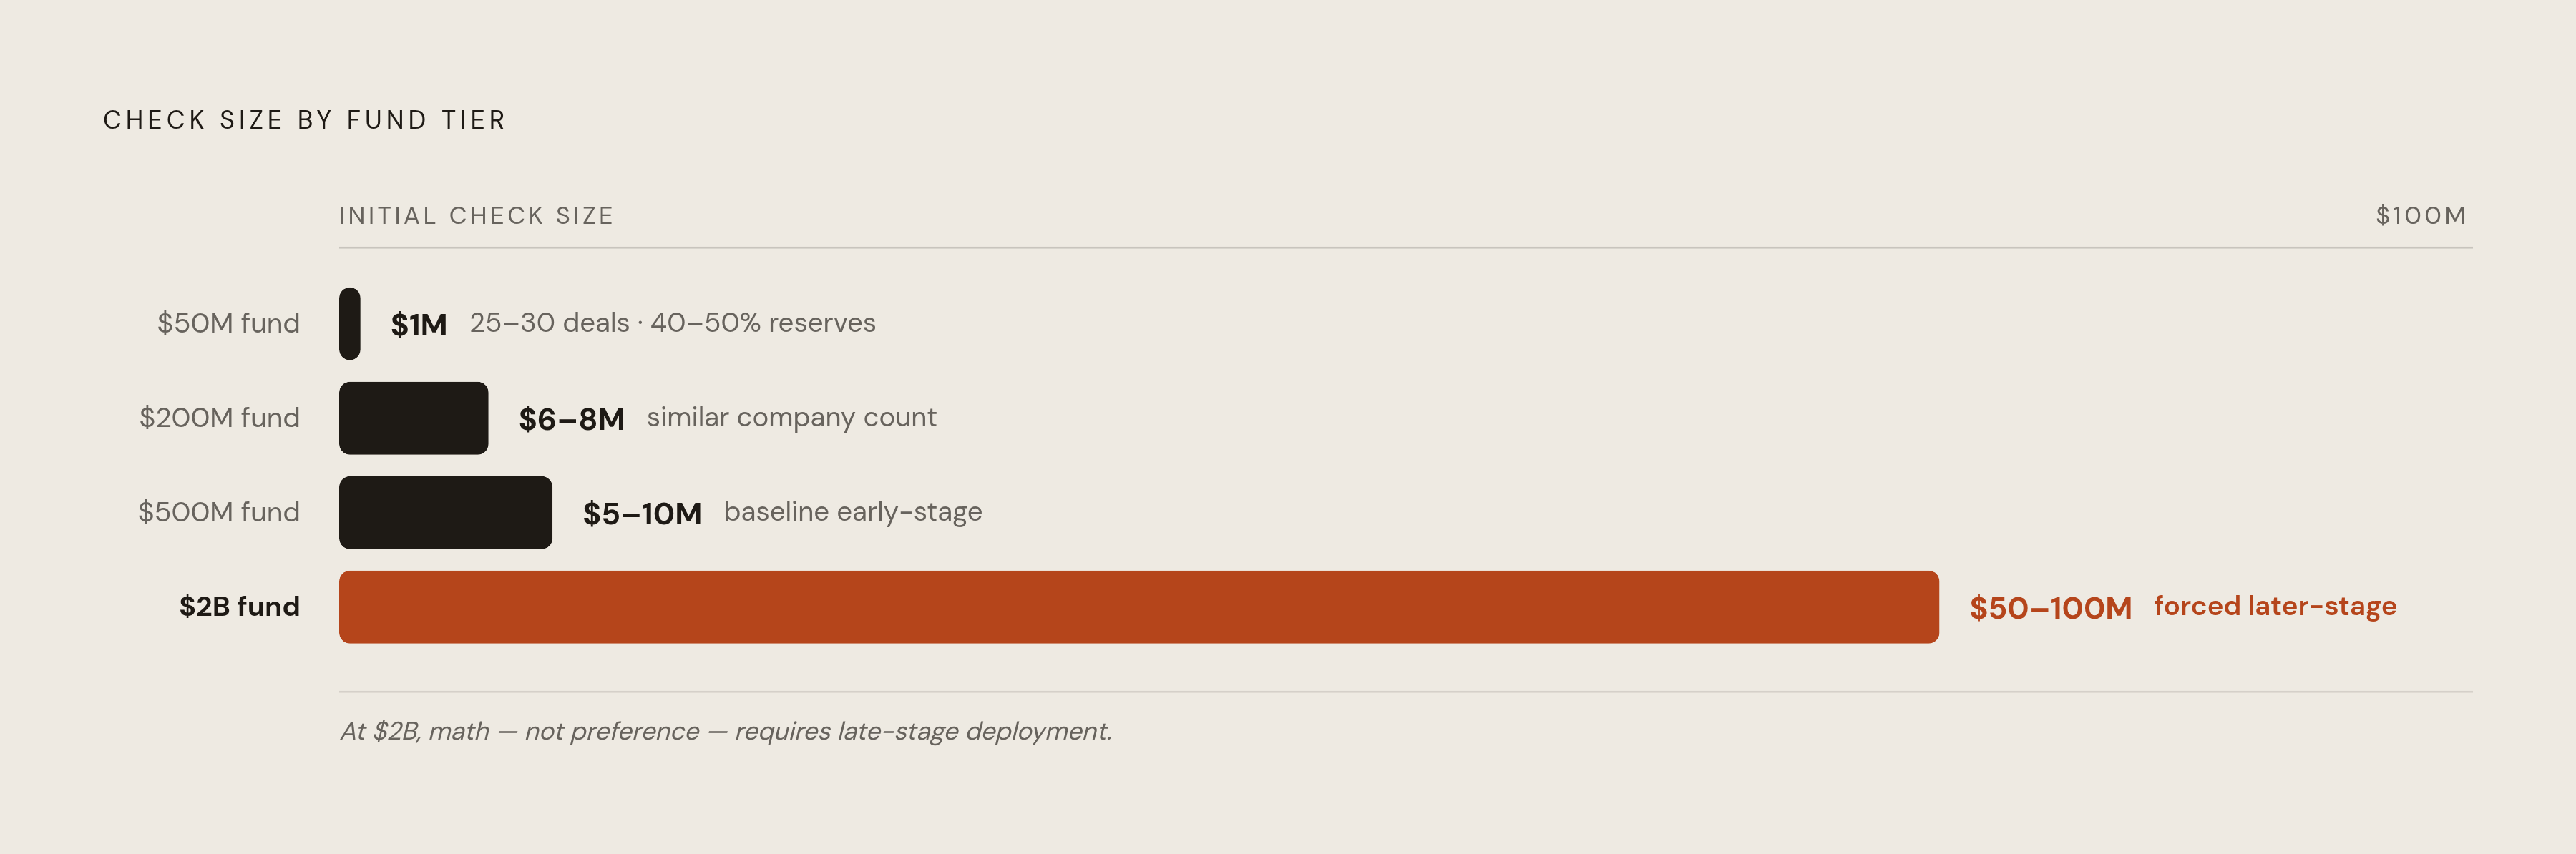
- A $50M fund writing $1M initial checks can make 25 to 30 investments while reserving 40 to 50% for follow-ons
- A $200M fund with a similar company count writes $6 to 8M average initial checks
- A $500M fund is writing $5 to 10M initial checks as a baseline
Once you get above $1 billion, you cannot efficiently deploy capital in $2M increments. The partnership drowns in deal volume before the fund closes. A $2 billion fund needs checks in the $50 to 100M range to deploy over a three to four year investment period. That math forces larger funds into later-stage, lower-risk deals. Not by preference. By structural necessity.
At the seed stage in 2024 and 2025, firms writing $1 to 3M checks and targeting 10 to 20% ownership are building portfolios of 20 to 40 companies per vintage. Median Series A rounds hit $15M in Q4 2024 per PitchBook. That context matters when you are calibrating check size to ownership target.
The emerging manager advantage here is structural, not sentimental. Smaller funds can access deals that larger competitors cannot economically pursue. A $500M fund cannot spend a week doing diligence on a $2M seed round. A $30M fund absolutely can. The best small managers lean into this deliberately rather than treating it as a consolation prize for not having raised more money.
Fund size is therefore also a market positioning decision. Where can you actually compete? That question deserves a real answer before you set any of the other variables.
Ownership targets and why they determine whether a winner moves the fund
This is the one people get wrong most often. And it is the most consequential mistake in the whole construction model.
The power law only helps your fund if you own enough of the outlier to feel it at the portfolio level. A company can return 100x. If you own 0.5% of it, the math is pretty disappointing. Ownership at entry is not a negotiating footnote. It is the whole game.
Most seed-stage funds target 7 to 15% ownership at entry. That range reflects real flexibility depending on valuation, founder quality, and co-investment dynamics. A useful rule of thumb: fund managers generally need 20 to 25% ownership post-money to justify a board seat and real active involvement.
Valuation sensitivity makes this harder than it sounds. At a $40M post-money Series A, getting to 20% ownership requires an $8M check. Double the valuation, and you double the required check. Ownership targets and check sizes are not separate decisions. They are the same decision, and treating them separately is where models start drifting from reality.
Rising valuations have forced a lot of managers to revisit their minimum ownership thresholds. The entry valuations of five years ago are not the entry valuations of today, and a model built for the old environment does not automatically hold for the new one. This should be obvious, but a lot of fund models get built once and then defended past the point of sense.
A $30M fund writing $300K checks into 100 companies will not generate venture returns. The math requires concentration. The number of investments and the ownership per investment have to cohere. Long-term outcomes are shaped far less by how many bets you make than by whether you maintain ownership and concentrate follow-on capital behind your highest-conviction positions when it counts.
The follow-on decision: where portfolio construction either compounds or collapses
Follow-on allocation is widely considered the single most consequential lever in portfolio construction. This is where the original thesis either gets confirmed with real capital or quietly abandoned while the GP tells themselves the company just needs more time.
Typical reserve ratios run from 40 to 60% of total fund capital, with some funds going as high as 50 to 70%. Pro-rata rights exist specifically so managers can preserve ownership in their best companies through subsequent rounds. GPs fight hard for those rights, and for good reason.
The 2024 market made this dynamic visible. Annual cash raised grew 78.8% at Series D and 82% at Series E and beyond. That tells you where investor conviction was concentrating: in maturing portfolio companies, not in early-stage spread.
The micro-VC reserve trap is worth naming directly. If you spread your initial capital across too many companies, your reserves get spread too thin to matter. Allocating 10 to 15% of a fund to follow-ons rarely moves the needle enough to change outcomes. In many situations, modestly increasing initial check sizes up front is simply more effective than holding a small, broad reserve allocation that cannot do meaningful work when the moment comes.
The most common emerging manager mistake is failing to reserve sufficiently, then running out of capital before a new fund is raised. The result is dilution in the exact companies that deserved more capital. It is painful. It is avoidable. And it happens constantly because the reserve ratio felt fine at fund inception before anyone had seen actual loss rates.
Sophisticated managers increasingly use internal scoring models to make follow-on decisions based on real-time company performance. The goal is to avoid the sunk cost trap: putting more money into an underperformer because you already put money in, while a genuine winner gets underserved. That kind of honest accounting is harder than it sounds when you have a relationship with the founder and a narrative you have been telling your LPs for two years.
The dimensions of diversification that actually reduce construction risk
Diversification in venture is not what it is in public markets. It is not about smoothing returns across holdings. It is about reducing structural risks that have nothing to do with individual company quality: timing, geography, sector cycles. Those risks are real, and most emerging managers do not think about them explicitly enough.
A few dimensions worth understanding:
Stage. Seed-stage funds can get meaningful outlier exposure with smaller checks. Australian data shows that smaller VC funds returned at least 2.5x to investors at a higher rate than larger funds above $750M. Smaller does not automatically mean worse. It can mean more focused.
Sector. Spreading exposure across fintech, healthtech, SaaS, and climate tech diversifies your exposure to sector-specific cycles. But over-diversification across sectors causes thesis drift and stretches a GP's ability to add genuine value. At some point, you stop knowing your companies' markets better than the founders do. That is a bad place to be, and founders notice.
Geography. North America captured $91.5 billion, or about 62% of total global VC funding, in 2024. Silicon Valley alone represented roughly 49% of global venture capital in Q1 2025. Emerging hubs in Austin, Miami, Berlin, Tel Aviv, and Singapore are gaining real momentum. Per Silicon Valley Bank's Future of Frontier Technology report, the U.S. Midcontinent surpassed the East Coast in total VC funding in 2024. Geographic diversification reduces concentration in a single regulatory and economic environment, which matters more than most people think until a regulatory environment turns hostile.
Vintage year. Best practice calls for spreading investments across three to five vintage years to reduce timing risk. In fund-of-funds structures investing across 25 or more funds, the probability of a sub-1.5x multiple drops from 26% to 9%. That is a meaningful reduction from a single structural choice.
Past a certain point, though, adding more dimensions of diversification dilutes the GP's actual edge. Diversification is a risk management tool, not a substitute for thesis conviction. Managers who treat it as one tend to end up with a portfolio that looks tidy on paper and performs mediocrely in practice.
How the variables combine into a coherent construction model
A construction model is a system. Every choice constrains the others. To make this concrete, here is an illustrative $100M seed fund model:
- 30 initial investments at $2M each equals $60M deployed
- $40M reserved for follow-on in the top 10 performers, roughly $4M average per follow-on
- Target ownership of 10 to 12% at entry
At 30 investments, statistical modeling shows a very high probability of including at least one company that returns 50x or more. At $2M invested, a single position like that returns 2.5x the entire fund before any follow-on is even counted. Follow-on in that winner then compounds the outcome further. The model is not complicated. Getting people to actually stick to it is.
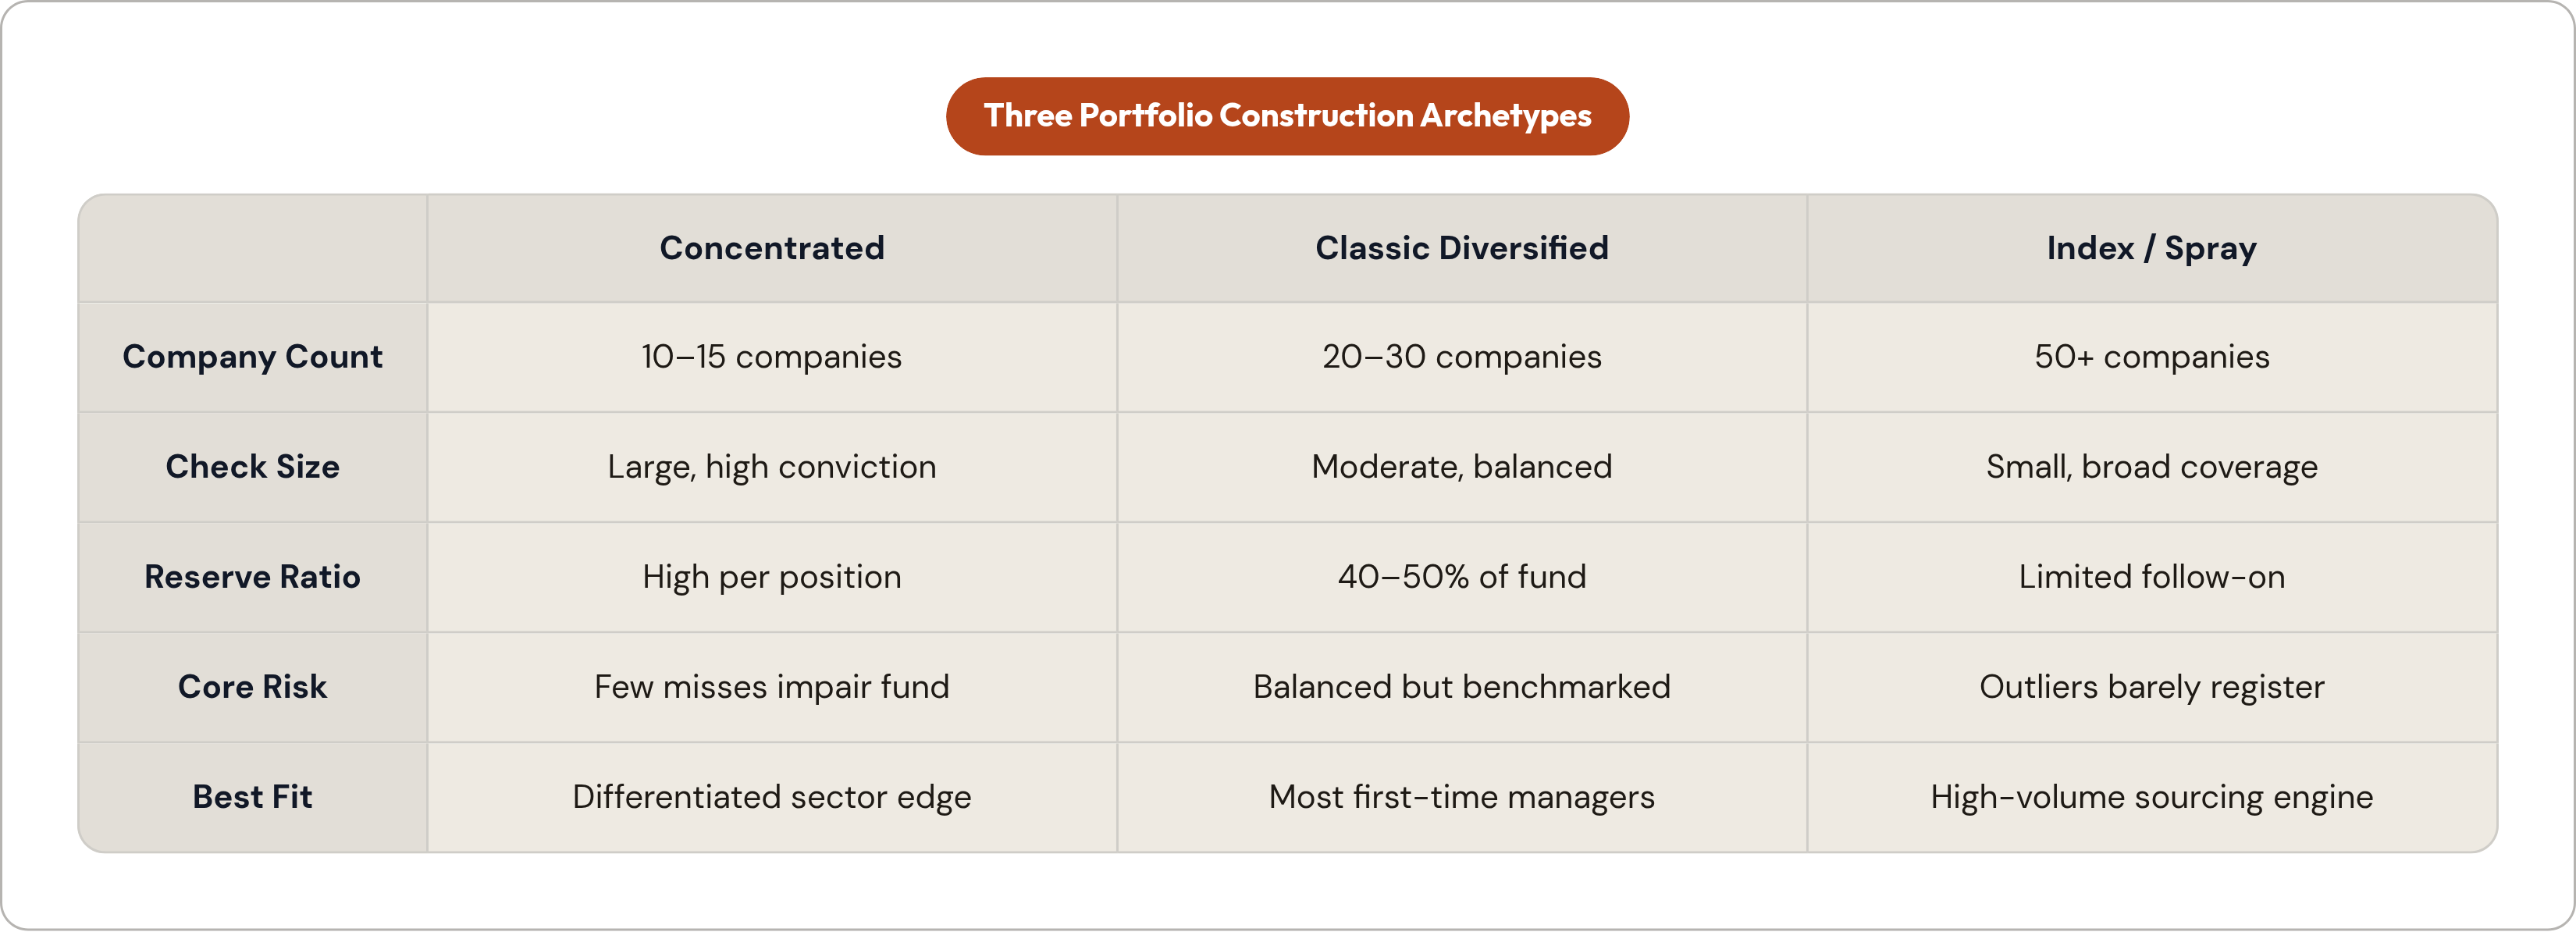
Three archetypes frame the design space:
Concentrated or conviction model. 10 to 15 companies, large checks, deep involvement, high ownership. Tolerates high variance. Requires exceptional deal selection. One bad run and the fund is impaired. This approach makes a lot of sense for managers who have a genuine, differentiated edge in a specific sector and can honestly defend their hit rate assumptions.
Classic diversified model. 20 to 30 companies, moderate checks, 40 to 50% reserves. This is the standard against which most funds get benchmarked. It balances outlier capture with operational manageability. Most first-time fund managers end up here, sometimes by design and sometimes because they ran the math and got scared of the concentrated model.
Index or spray model. 50 or more companies, small checks, limited follow-on. Maximizes coverage and depends on the power law doing most of the heavy lifting. The GP adds less to individual outcomes and more to deal volume. This works if you have the sourcing engine to justify it and are honest with yourself about how much value you are actually adding per company.
The coherence test for any model comes down to three questions. Does the check size actually get you to your ownership target at current market valuations? Does the reserve ratio leave enough capital to matter in the winners? Does the number of companies stay within the partnership's bandwidth to add genuine value? Most emerging GP models fail not because the thesis is wrong, but because the numbers do not survive contact with those three questions.
The quantitative tools GPs use to stress-test construction assumptions
A model built at fund inception does not stay accurate. Markets shift. Valuations move. Loss rates surprise you in ways you failed to anticipate. Sophisticated managers treat construction as a live discipline, not a document they filed away after the first close.
Monte Carlo simulations. Model thousands of fund outcome scenarios based on assumed loss rates, ownership at exit, and follow-on deployment. You are not getting a single answer. You are getting a range of answers and learning what actually drives the variance. The answer is usually more concentrated in one or two variables than you expected.
Scenario analysis. Stress-test the model against adverse conditions: compressed valuations, slower deployment, higher loss rates than you originally assumed. The goal is to identify which variables most destabilize your returns. Usually it is one or two levers, not everything at once. Knowing which levers matter is itself useful information, even if you never pull them.
Internal portfolio scoring. Quantitative frameworks for ranking portfolio companies by milestone progress, capital efficiency, and market signals. Used to inform follow-on decisions and specifically to avoid deploying reserves based on sunk cost reasoning. If a company is ranked in the bottom third of your portfolio, you need a very explicit reason to keep putting capital in. "We've been in since the beginning" is not that reason.
The output of these tools is not a formula that replaces judgment. It is a forcing function. It exposes where your intuitions about portfolio construction are unsupported by the underlying math. And in venture, where the difference between a 2x fund and a 5x fund often comes down to two or three decisions made under uncertainty, that kind of accounting matters more than most GPs want to sit with.