Building a Fundraising Pitch Deck for Series A
Series A investors now expect $2.5M ARR and strong unit economics before they'll seriously engage.

Let's start with the uncomfortable part.
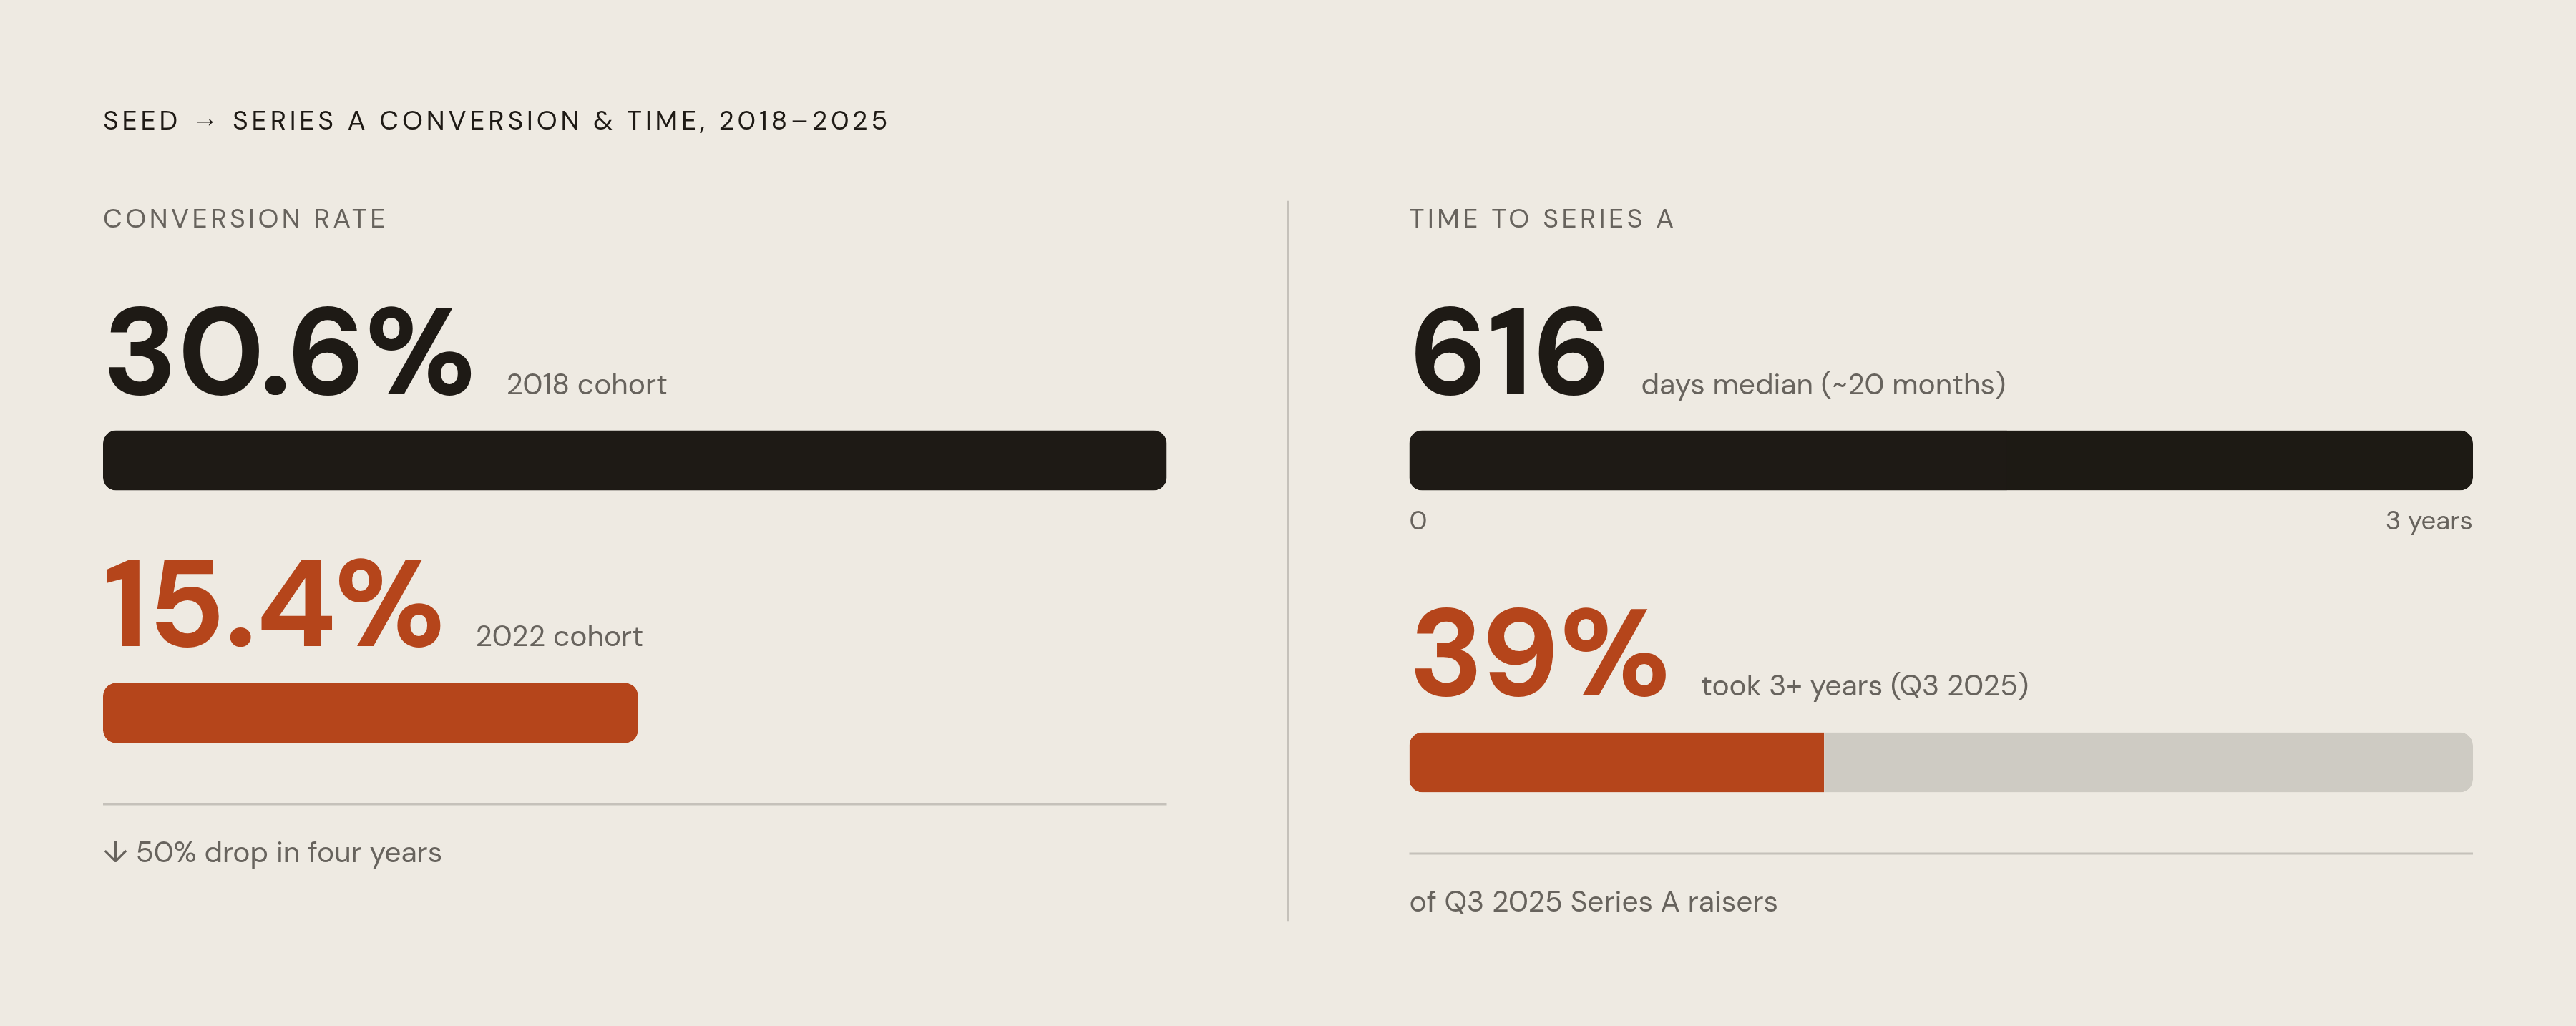
Only 15.4% of seed-funded startups from the 2022 cohort raised a Series A within two years. In 2018, that number was 30.6%. Roughly a 50% drop in conversion rate over four years. The market did not just get harder. It got structurally harder, and I am not sure most founders fundraising right now have fully internalized that.
It is also slower. The median time from seed to Series A is now around 616 days. Just over 20 months. About 39% of companies that raised a Series A in Q3 2025 took three or more years to get there. So if you are sitting at 14 months post-seed feeling behind, you are actually right in the middle of the pack. That is not comforting, but it is true.
Deal volume dropped year-over-year in Q4 2024. Total capital deployed at the Series A level fell in the same period. Slowest fourth quarter since 2018. Meanwhile, the top ten venture firms captured nearly 43% of all venture capital deployed in Q3 2025. Capital is concentrating. The big funds are taking bigger slices of a tighter market, and the middle of the distribution is getting squeezed.
Then there is the AI effect, which is genuinely distorting benchmarks for everyone.
AI startups commanded a 38% valuation premium over non-AI companies at Series A in 2025. That pulls the entire market average upward. So if you are not an AI company, you are being compared against round sizes and multiples inflated by companies that look nothing like yours. Your deck has to work harder to justify the numbers.
One practical note on timing: start fundraising with nine to twelve months of runway still in the bank. Expect three to six months from first outreach to close. The six-to-eight-week close exists, but it is the exception, not something you should plan around. Build your timeline around the median scenario, not the best-case one. Running out of runway mid-process is not just stressful. It hands negotiating leverage to the other side of the table.
The Traction Numbers Investors Expect to See Before Reading Further
Before we talk about deck structure, you need to know whether your numbers actually qualify. Because if they do not, a well-designed deck is not going to fix that.
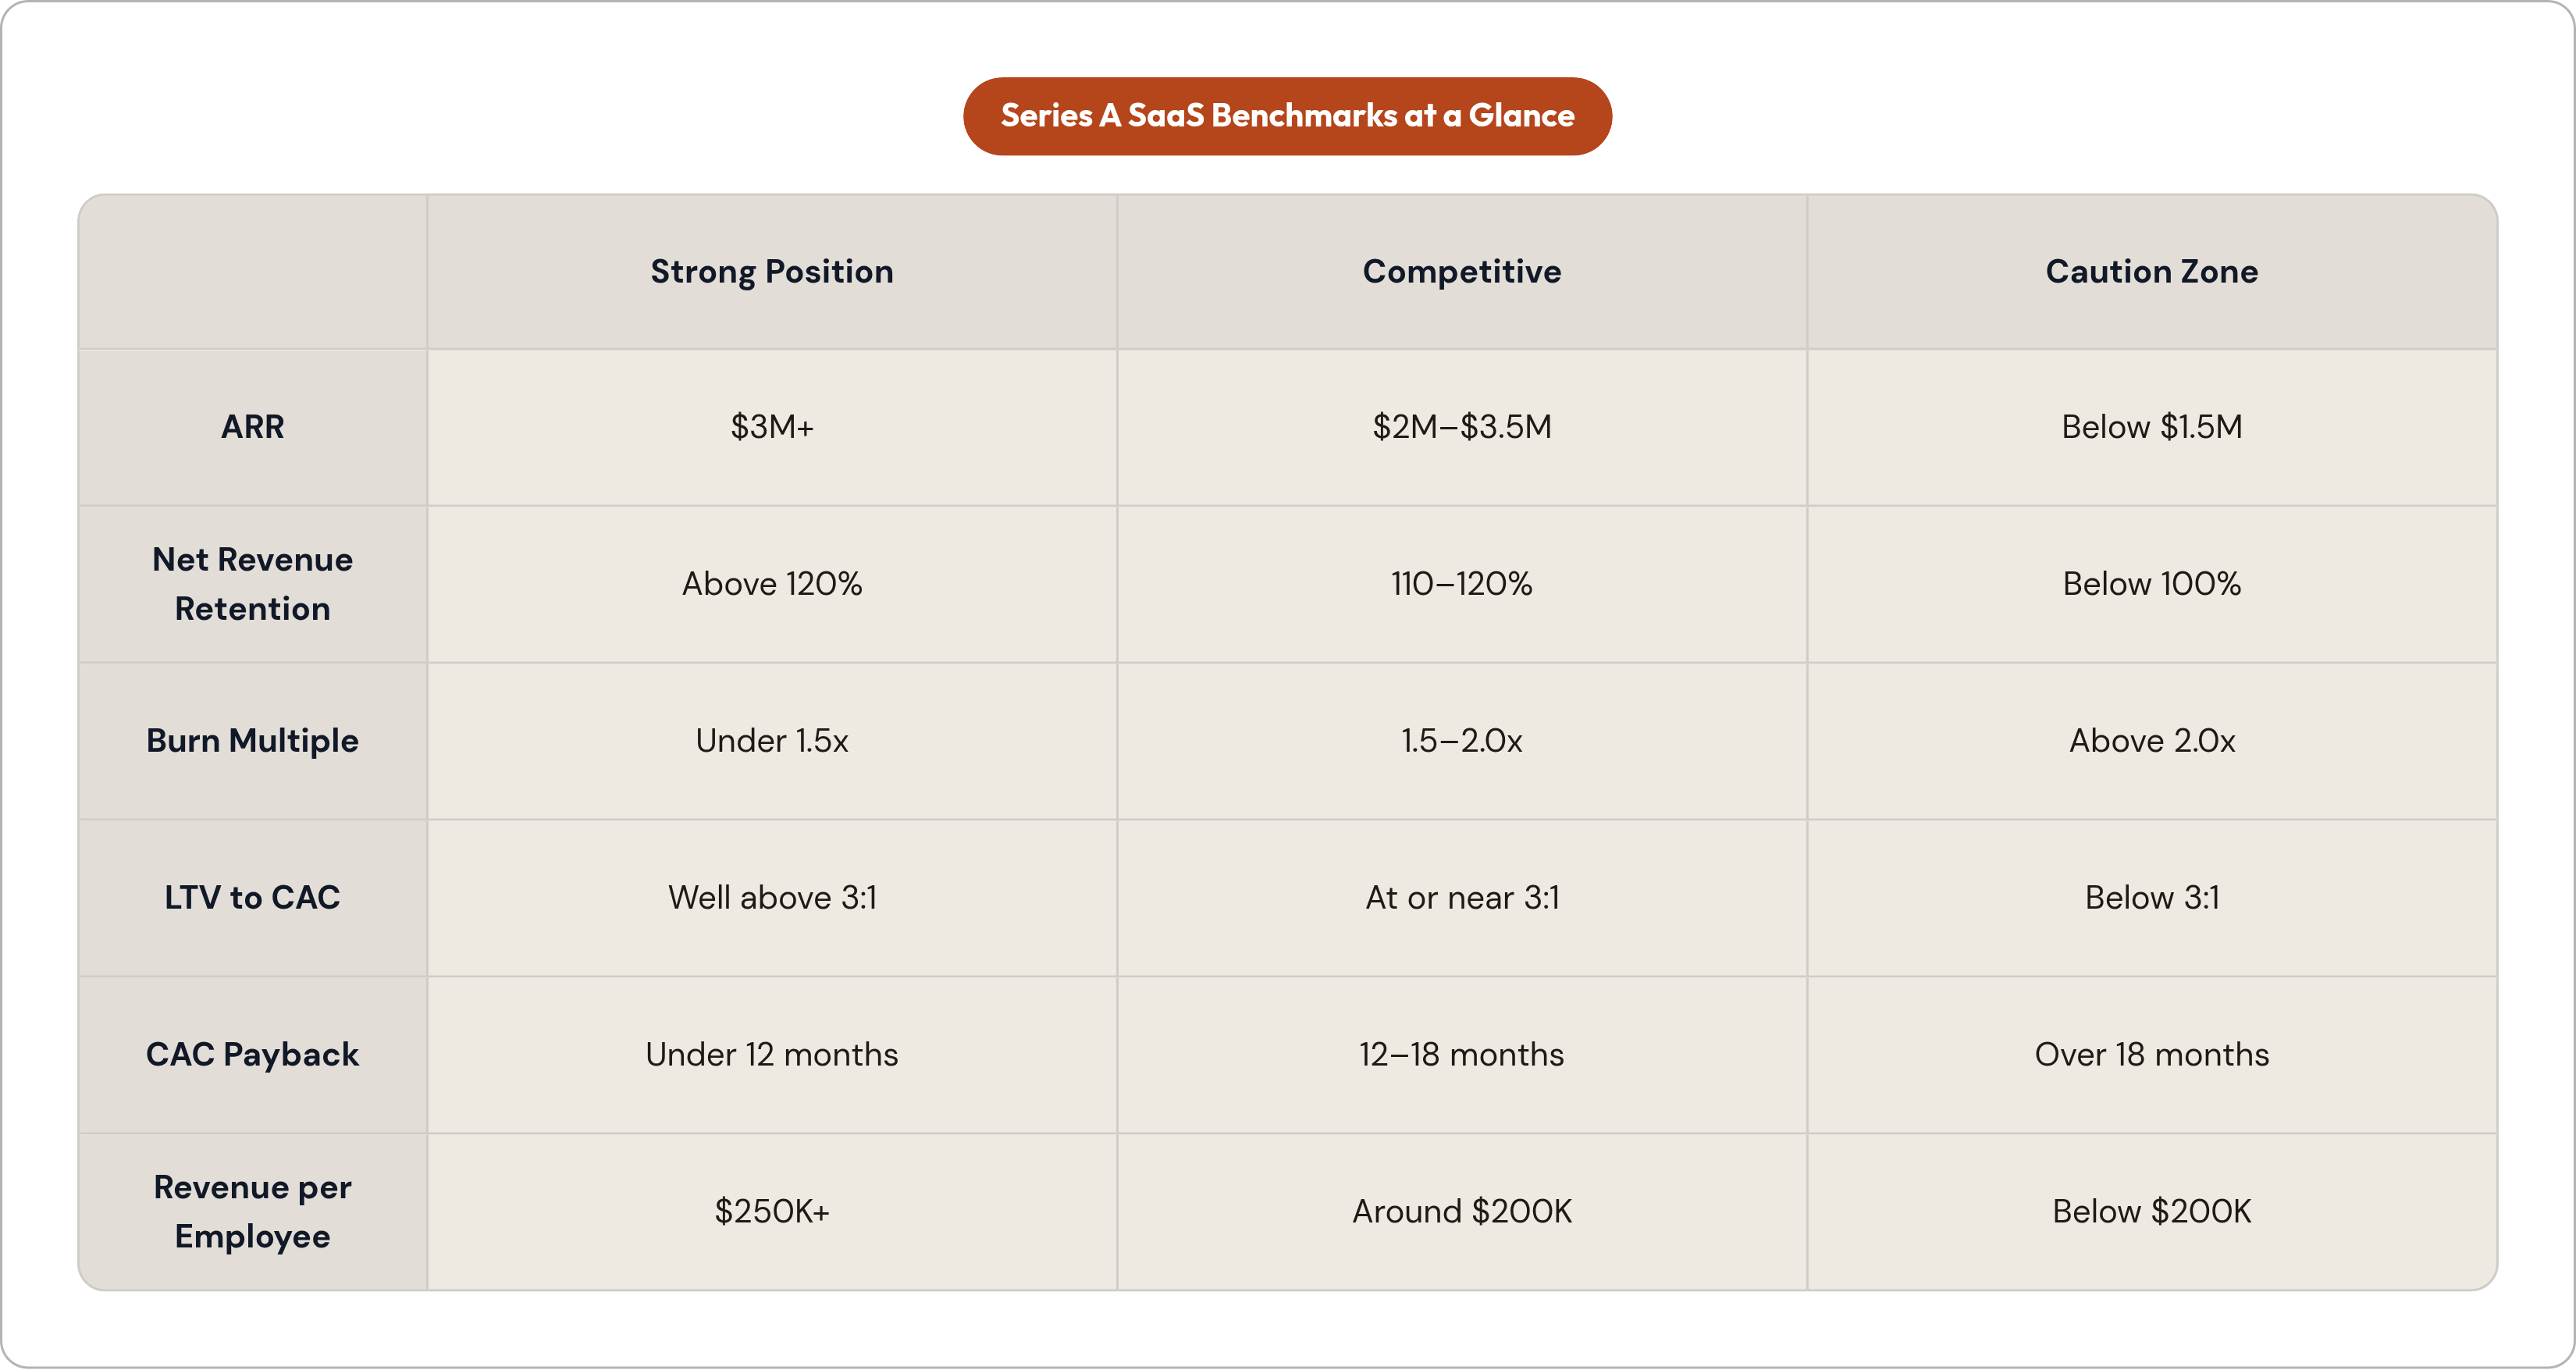
The median ARR at Series A reached $2.5M in 2025. That is roughly 75% higher than it was in 2021. The working range for SaaS companies is $2M to $3.5M. If you are below $1.5M ARR, you are probably not ready, and I say that not to be discouraging but because going out too early burns relationships you will need later.
Growth rate expectations scale with where you are:
- At $500K ARR, investors want to see 80 to 150% year-over-year growth
- At $1M ARR, the expectation is 50 to 100% year-over-year
- Consistent 5% month-over-month growth compounds to roughly 80% annually. That is Series A territory. Ten percent month-over-month compounds to over 200% annually. That is exceptional.
Net Revenue Retention (NRR) functions as a binary gate. Below 100%, the conversation closes fast. At 110 to 120%, you are competitive. Above 120%, you are in a strong position. NRR tells investors whether existing customers are expanding or quietly leaving, and it is one of the clearest signals of product-market fit you can put in a deck.
CAC payback over 18 months is a deal-breaker regardless of how fast you are growing. LTV to CAC should clear 3:1 as a floor. Below that, the unit economics story does not hold, and sophisticated investors will spot it in the first five minutes of diligence.
On burn multiple: under 1.5x is excellent, 1.5 to 2.5x is good, and the median Series A SaaS company in 2025 sits around 1.6x. If you are heading into a raise above 2.0x, prepare for hard questions.
Revenue per employee should exceed $200K. In the current environment, team leanness is itself a signal.
A few notes for non-SaaS businesses, because the benchmarks shift. Consumer companies generally need 100K-plus daily active users with strong retention. Marketplaces need meaningful GMV. AI-native companies often carry lower gross margins than traditional SaaS, closer to 50 to 60% versus 70-plus percent. Investors evaluating those businesses will focus on gross margin trend, inference cost management, and how embedded the product is in actual workflows. Standard SaaS thresholds do not apply cleanly.
Why Traction Belongs at the Front of the Deck, Not Slide Eight
The average investor spends roughly two minutes and 42 seconds on a cold deck. Across 12 slides, that is about 13 seconds per slide. Not 13 minutes. Thirteen seconds.
If your strongest metrics do not show up until slide eight or nine, most investors have already decided to pass before they ever see them. I have watched this happen. It is not dramatic. They just stop scrolling.
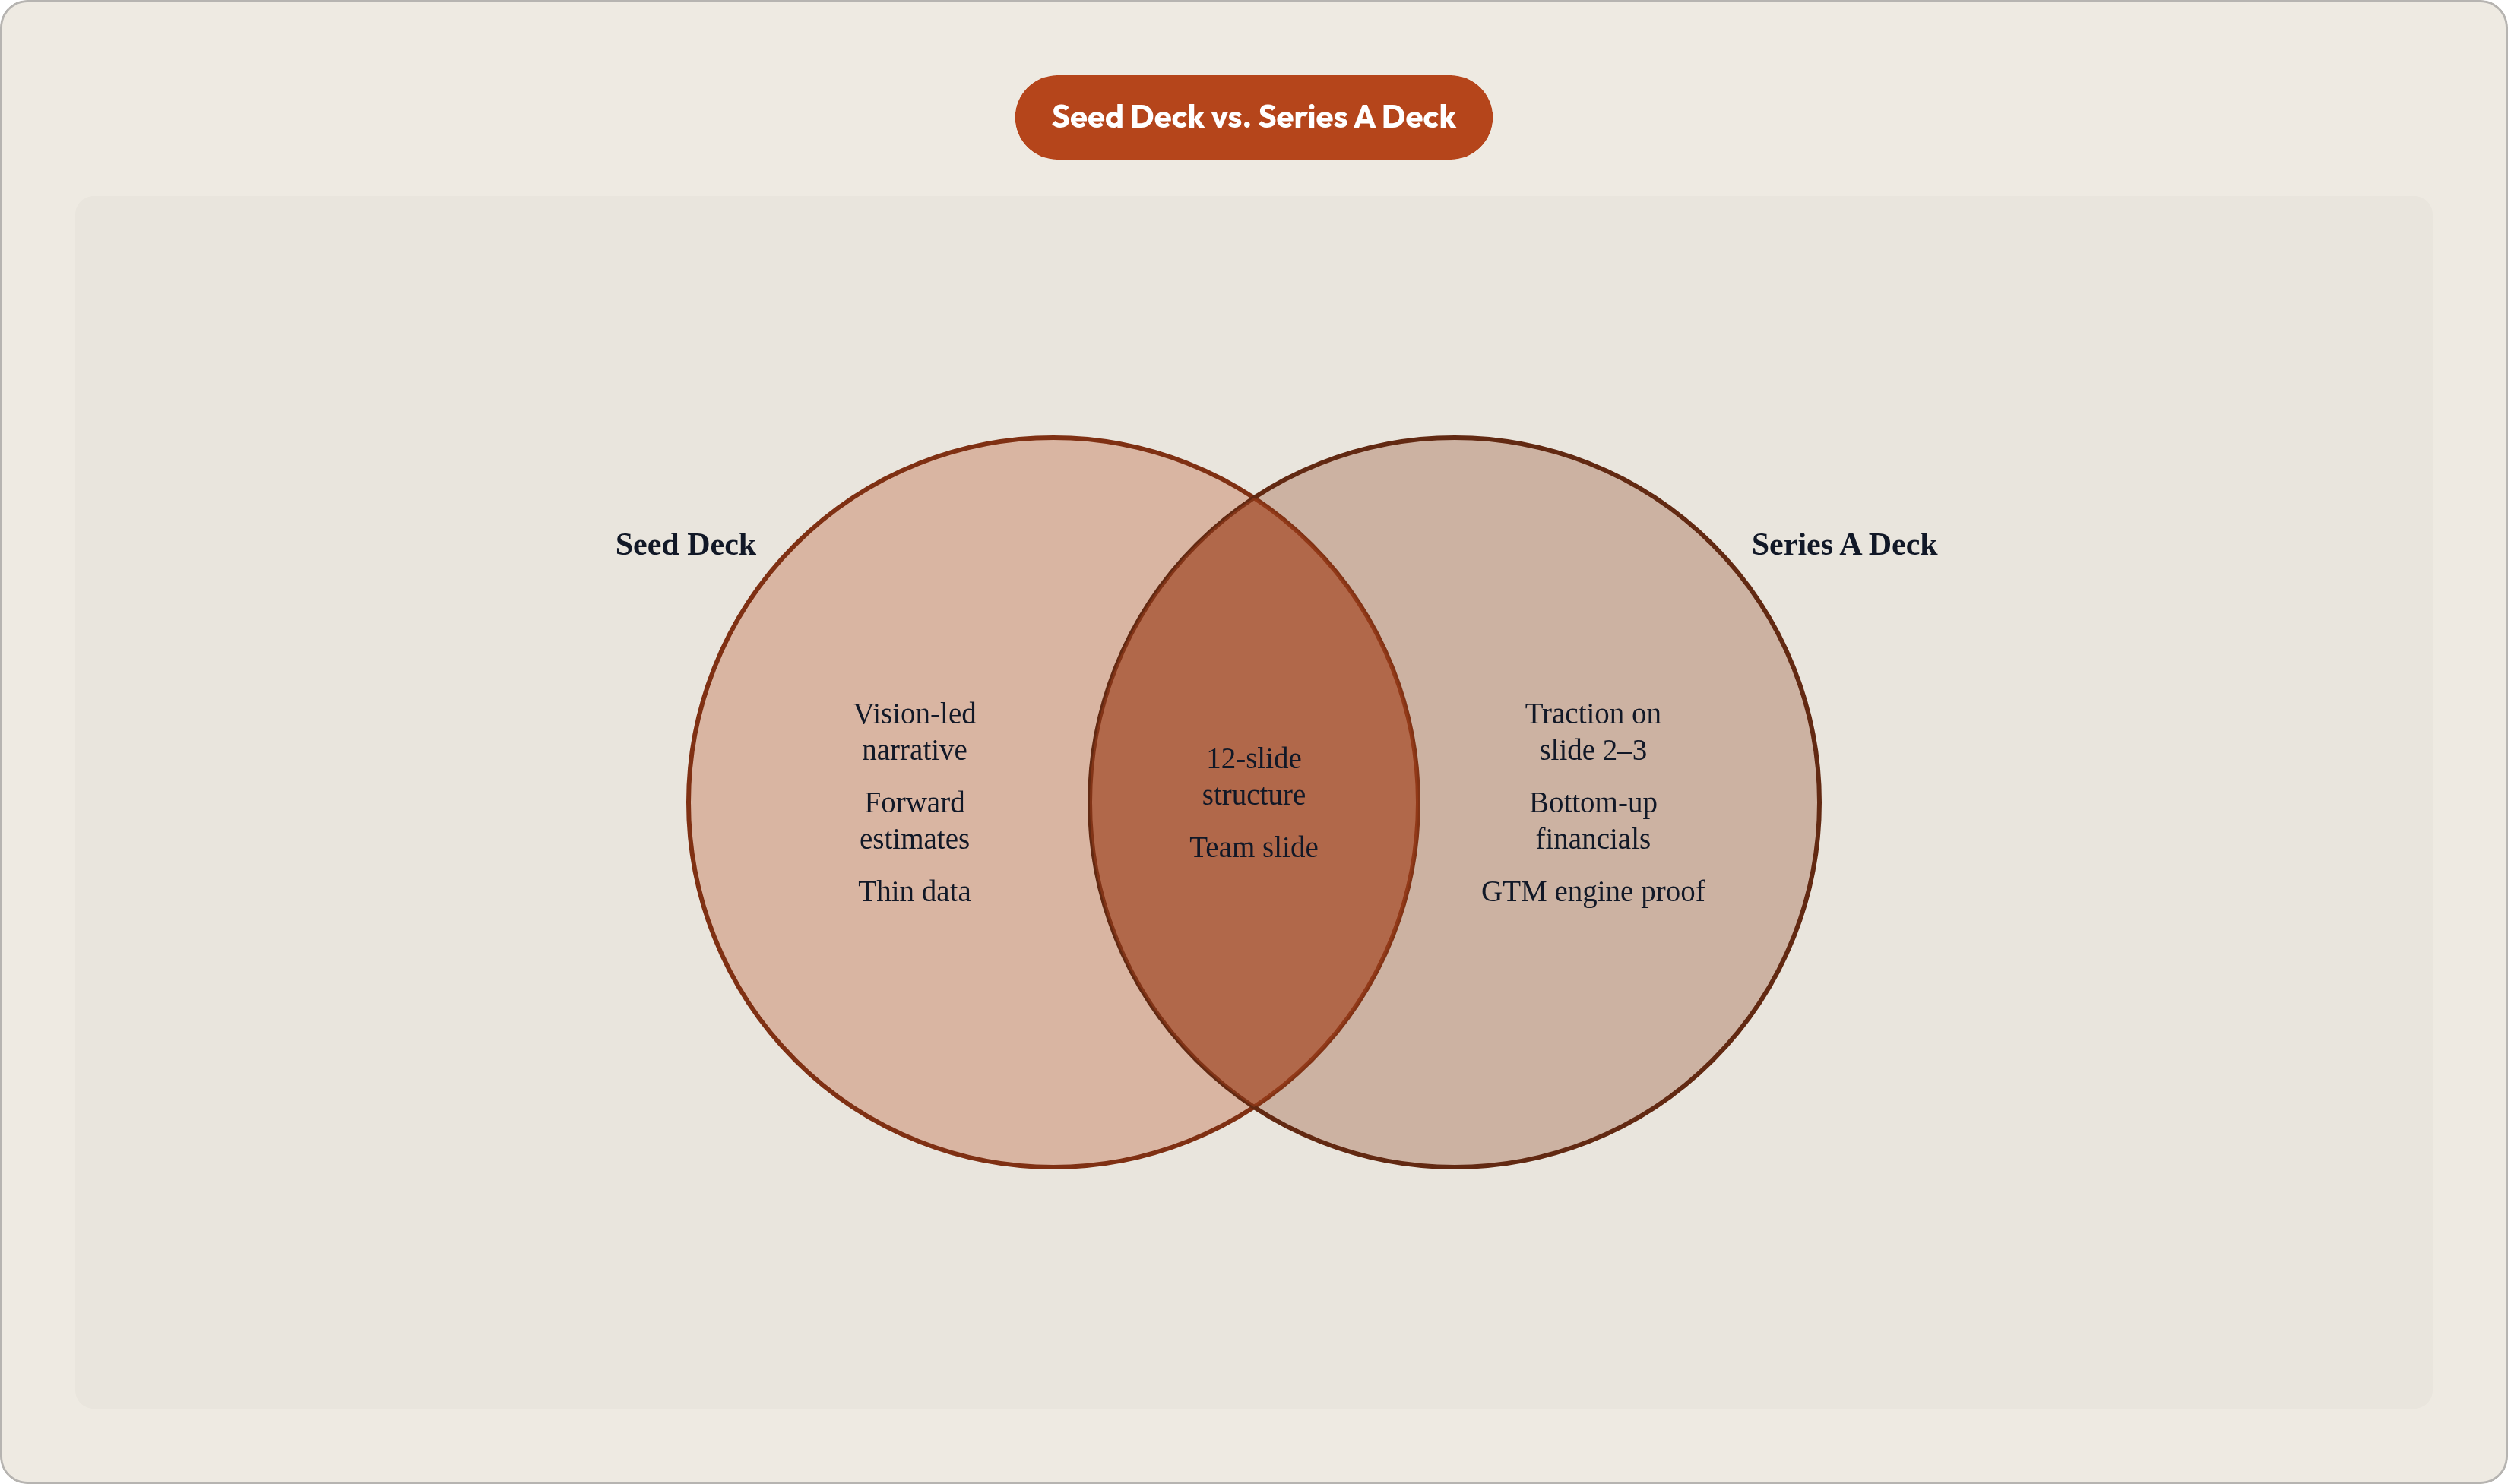
The classic seed deck order looks like this: problem, solution, market, product, traction. That structure made sense when you were selling a vision with thin data behind it. At Series A, it is the wrong order. Traction belongs on slide two or three. Your ARR, your growth rate, your NRR. Those are the numbers that answer the only question that actually matters at this stage: is this scalable? Put the answer early. Let the rest of the deck explain how you got there and where you are going.
This is not a stylistic preference. It reflects how Series A investors actually move through decks. They are not reading for narrative. They are screening for signal. Give them the signal first, then build the story around it.
There is a useful side effect here too. Moving traction forward forces you to make real editorial decisions. You have to figure out which metrics you are most proud of, which ones actually tell the story, and which ones are just noise. That process makes the whole deck sharper. It is uncomfortable, but it is good discipline.
The Job Each of the 12 Slides Must Do
Analysis of funded decks from 2024 and 2025 points to a consistent structure. Twelve slides is the median. Sequoia's format, which became the global default, is built on ten. The optimal range for Series A is 12 to 16. If your deck is 25 slides, that is not thoroughness. That is a sign you cannot prioritize. Everything beyond 16 slides belongs in the data room, not the first email.
Here is what each slide actually needs to do:
Cover. Logo, one-line value proposition, founding year, current round. Tell the investor immediately what they are looking at.
Traction (moved forward). ARR, growth rate, NRR. These are the numbers that earn the next ten minutes of someone's attention.
Problem. Three to four sharp bullets and one bold data point. No dense paragraphs. The goal is to make the scale of the pain undeniable, not exhaustive. If a reader can feel the problem in 15 seconds, the slide worked.
Solution. One clear statement of what you do. Two to three key benefits. A product screenshot or a simple workflow diagram. When you can show, show.
Why Now. This slide gets skipped more than any other, which is a real mistake, because it is frequently the most decisive slide in the deck. What changed? A new technology, a regulatory shift, a behavior change, a cost curve that finally tipped. A credible "why now" turns a nice product into an inevitable one. Without it, investors are quietly wondering why this did not exist five years ago and why it will not get built by someone else tomorrow.
Market Size. Most decks lose credibility here. Investors have seen every version of the "$50 billion TAM, we only need one percent" slide. It does not work. Bottom-up sizing from actual customer data beats top-down guessing every time. Show your math.
Product. Demonstrate if you can. A live demo or a short screen recording usually does more work than any static slide.
Business Model. Revenue mechanics, pricing structure, how the unit is defined. Investors need to see that you have thought through monetization at scale, not just at your current customer count.
Competition. The goal is not a feature comparison matrix. It is demonstrating your structural moat. Competitors can copy features. They cannot easily copy distribution, data advantages, or switching costs that are baked into daily workflows. Show the position, not the checklist.
Go-to-Market. This slide carries disproportionate weight at Series A. More on this below.
Team. Investors reportedly spend over 15% of their total deck-reading time on the team slide. Keep it to core leadership. Listing advisors often weakens the slide rather than strengthening it, because experienced investors know what a padded advisor section usually signals. A missing technical co-founder is a conversation-ender, not something you can cover with an advisory board.
Ask. The closing argument. More on this below.
How to Build the Financials Section So It Withstands Diligence
Seed decks could get away with forward-looking estimates and a healthy dose of optimism. Series A financials cannot, because now you have actual operating history. That history is the whole point.
You need a multi-year financial view: revenue growth, high-level spend, burn rate, customer count. A five-year view with detailed backup in the appendix or a separate model. When investors see strong revenue history, they often barely engage with the long-range forecast, because the traction is speaking louder than the projections. But the model still needs to survive scrutiny when they do look at it closely.
The single most common mistake that kills credibility fast: presenting 10x growth assumptions with no bottom-up justification. How many sales reps, at what quota, hitting what conversion rates, producing what revenue? A top-down guess signals that the founder has not done the operational work yet. That is a fast way to lose a room.
By Series A, CAC, LTV, and the ratio between them must come from actual operating data. Not projections. You did not have these numbers at seed. You have them now. Bring them.
One of the more persuasive signals in any financial section is a tightening burn multiple shown across quarters. It tells investors that the business is getting more efficient as it scales, not just burning more. Improving capital efficiency over time is not just a nice trend. At this stage, it is a core part of the scalability argument. It is the difference between "we are growing fast" and "we are building something that actually works."
What the Go-to-Market Slide Must Prove, and Why Most Founders Get It Wrong
The real question investors are asking when they look at your GTM slide is not complicated.
Is this growth the result of a system, or is it the result of the founder making calls?
Founder-led sales is solid early evidence of product-market fit. I have seen it work beautifully at seed. But it is not a scalable acquisition channel, and at Series A, the deck needs to show that you are graduating from it. The whole point of the round is to build the engine that does not depend on you being personally in every deal.
A repeatable go-to-market engine has defined channels, measurable conversion rates, a clear ideal customer profile, and a sales motion that does not fall apart if you remove one person from the process. If it only works because of one specific person, that is a key-person risk, not a growth engine.
Show the funnel with real data. Leads to qualified pipeline to closed revenue, with conversion rates at each stage. That specificity is what makes investors lean forward. It shows you know your business operationally, not just directionally.
One more thing worth saying directly. If 80% of your new ARR is coming from a single channel or a single customer segment, that concentration is a risk. Do not bury it. Name it and explain what you are doing about it. Investors already know the question will come up in diligence. Raising it yourself signals that you are running the business like an adult.
The GTM slide and the traction slide should reinforce each other in a specific way. Traction shows what has happened. GTM explains why it will keep happening at higher volume. Together, those two slides are the core of the scalability argument. If they do not connect clearly, the rest of the deck is working against itself.
How the Ask Slide Closes the Case the Rest of the Deck Has Built
The ask slide is not a budget summary. It is the final argument for why this round, at this size, at this moment, produces a specific and credible outcome.
Some useful benchmarks for 2025: the average Series A round size in Q3 2025 was approximately $18.1M, with a typical range of $10M to $15M. Post-money valuations ranged from roughly $40M to $67M. Median pre-money valuation for primary rounds was approximately $49.3M. Median dilution was 17.9%, down from 20.9% the prior year. Founders who walk into valuation conversations knowing those numbers negotiate from a fundamentally different position than founders who do not.
The use of funds needs to map directly to milestones that make the Series B narrative obvious. Not vague budget categories. Specific, measurable outcomes.
Not "sales headcount." Something like: "Hire four account executives to reach $5M ARR by Q2 2026."
Not "product development." Something like: "Ship the enterprise SSO integration by Q3, unlocking the mid-market segment."
Each allocation should connect clearly to the repeatable engine you have already demonstrated in the traction and GTM slides. The ask slide is not introducing new information. It is landing the argument the whole deck has been building. If it feels like a surprise, something earlier in the deck did not do its job.
Accompany the ask slide with an appendix prepared for diligence: a detailed financial model, customer references, cohort analysis, a legal summary, and a cap table overview. This signals that you have already thought through the next conversation, not just the first one.
The founders who close Series A rounds in this market are not the ones with the cleverest decks. They are the ones who walk in already knowing what scaling actually requires, and who can show, slide by slide, that they have already started building it.